
There's an interesting report out from the U.S. Energy Information Administration on electrical supply and consumption trends [note 1].
There's been a great deal of discussion about energy in the news in recent months. From new finds of shale oil in the continental US to bans on offshore drilling to impassioned discourses on the "ethics" of Alberta's oil sands (in contrast to oil and other petroleum products the sale of which benefits less savoury regimes in Venezuela, Saudi Arabia, Russia and Iran), the subject of energy consumption has...well, consumed us.
And well it should. One of the charges routinely levied against the developed world by advocates for underdeveloped nations is that the "first world" nations only got rich through unfettered expenditure of natural resources, especially energy resources. That's quite correct. As I noted in a previous message (back on 17 November), there is an observable correlation between per capita energy consumption and per capita GDP. Critics generally cast this in terms of "the rich countries consuming the most energy", implying that the developed world's energy consumption is a consequence of its wealth. This is precisely backwards. History demonstrates that the arrow of causality points in the other direction; that wealth is, in fact, a consequence of energy consumption - or, more precisely, a consequence of the emergence of expert and efficient transformation of energy into power, which is best defined as energy in a useful form.
This shouldn't surprise us, frankly; there are direct parallels in nature. At the risk of anthropomorphizing our nonhuman relatives, in the natural world, success, defined in evolutionary terms, tends to be linked to the emergence of evolved biological mechanisms (genetic "expertise", in a Darwinian sense) for maximizing the capture and efficient exploitation of energy. Among the plants, this translates into such phenomenon as trees with broad canopies and broader leaves, better enabling tall, spreading structures to outdo competitors for available sunlight. Other evolutionary adaptations - e.g., the relatively high tolerance for acidic soils displayed by the black spruce - enable the plant to exploit previously unexploitable land spaces and, therefore, the sunlight that falls on them. The Douglas fir competes for energy by outgrowing competitors; the black spruce competes for energy by being able to grow where competitors cannot. Similarly, in the animal kingdom, efficiency in gathering and exploiting available energy is the hallmark of a successful species. Herbivores evolve towards optimization for exploiting non-dense carbohydrate sources like grasses and grains, while carnivores evolve towards optimization for exploiting far denser energy sources stored as fat and protein by their herbivorous prey. Success, insofar as living things are concerned, is measured by survival - which, in turn, is the result of outdoing competitors in the race to exploit available, and always finite, sources of energy.
This makes energy consumption a potential proxy measure for success. As already noted, both above and in my 17 November message on how the "constructal law" governs energy consumption in a macroenvironment, the developed - which is to say, the Western - world already vastly exceeds the per capita energy consumption of the rest of the world. What is interesting, though, is how those consumption patterns evolve both over time, and in response to external stimuli.

Figure 1 - U.S. Energy Consumption per capita, 1950-2010
(source: author)
Consider, first, how U.S. energy consumption per capita has changed over the past half-century. In 1950, the population of the U.S. was about 152M, and its annual energy consumption was roughly 36.6 quads (quadrillion BTUs of primary energy, which is to say all energy consumed for heating, electrical power generation, transportation, and so forth, expressed in British Thermal Units, a standard measure of energy content, especially for fossil fuels). This chart shows three periods of statistical interest. First, from 1950 to 1970, we see a period of growth in per capita energy consumption, likely reflecting the post-War affluence of U.S. society, the explosion of the middle class, and the massive expansion of the U.S. economy during this period. The amount of energy consumed by each individual American increased by about 50% during this period. Then, from 1970 to 2000, we see a long period of relative stability. Remember, however, that this is not stability either in population or in energy consumption; between 1970 and 2000, the U.S. population grew by 76M persons, or more than a third, while its gross energy consumption increased by a like proportion, from 67.8 to nearly 100 quads. This period, though, also saw significant growth in the US GDP. In 1973, the US per capita GDP was $16,689, while by 1998, this had increased to $27,331 (both in constant 1990 dollars). In other words, per capita GDP increased by 64% during a period when per capita energy consumption increased by only 6% (from 0.33 to 0.35 GBTU/person). What this tells us is that the U.S., between 1970 and 2000, got much more efficient at generating dollars of GDP per unit of energy consumed.
The third period of interest, of course, is 2000 to today. The last ten years, according to the above statistics, have seen per capita energy consumption in the U.S. decline to levels not seen since the late 1960s. This could mean one of three things (or, possibly, a combination of all three). First, the rate of U.S. population growth could have undergone a sudden increase. Second, the U.S. could suddenly have become even more efficient at turning energy into GDP. And third, the amount of energy consumed by the country as a whole could have precipitously declined.
Easy enough to investigate. First, has the U.S. population suddenly and precipitously increased?

Figure 2 - U.S. Population Change 1950-2010
(source: author)
Nope. The rate of population growth in the U.S. has been pretty much constant since 1950.
Second, has the U.S. suddenly become massively more efficient at turning energy into GDP? That's a lot harder to evaluate. However, we can eliminate it as a possibility by looking at the third possible cause of the drop-off in per-capita energy consumption: whether there has been an across-the-board decline in U.S. energy consumption. Data published by the U.S. Energy Information Administration suggest that this is, in fact, what has happened.

Figure 3 - U.S. Energy Consumption from all sources, 1949-2009
(source: author)
Bumpy charts are, of course, a lot more interesting than straight ones. When you consider that U.S. population growth has been a more or less straight line since 1950, you can eliminate population fluctuations (or uneven growth patterns) as a potential cause of fluctuations in US energy consumption. This makes the peaks and valleys in overall energy consumption patterns all the more interesting. In the above chart, we see a very minor decline taking place in 1953-54; a slightly more precipitous decline from 2000-2001; a still heftier decline from 1973-1975; an even more significant decline from 1979-1983; and the beginnings of what looks like the steepest drop-off in recent history, taking place between 2008 and today.
Where it gets interesting is when these patterns are correlated to historical events. We tend to forget about the 1953 recession, which was a consequence of the end of the Korean War. The others, however, we are far more familiar with.

Figure 4 - U.S. Energy Consumption 1949-2009 (major recessions noted)
(source: author)
(BTW, I've labelled the 1981-83 economic downturn the 'Reagan Recession' because it occurred during Reagan's first term, and because his economic policies were responsible for the US recovery and boom that took place - and that, half a decade later, drove a stake through the heart of the Soviet Union. But that's a tangential issue and I don't intend to discuss it further here.)
A number of interesting points emerge from this chart. First, the magnitude of the decline in overall U.S. energy consumption as a consequence of the present recession is greater than at any point in the past 60 years. Second, the rate of decline in overall U.S. energy consumption (as indicated by the slope of the line from 2007 onwards) of the present recession is more rapid than at any point in the past 60 years. This latter point was emphasized by the U.S. Energy Information Administration, when, on 23 November 2010, it released its summary report for electrical generation statistics in the U.S. for the 2009 calendar year. According to the EIA, electrical generation in 2009 in the U.S. was down 4.1 percent, reaching its lowest level since 2003, representing "the largest decline in 6 decades". The greatest area of decline was in industry, which used 9.1% less electricity than it did in 2008, bringing industrial electrical demand to its lowest level since 1987 - a development, the EIA notes, that "reflected the 9.3% drop in industrial output, as measured by the Federal Reserve Bank's index of industrial production."
A 9% drop in industrial electrical demand is a lot. So is a 9% drop in industrial output.
Well, where's the power coming from anyway? The EIA also provides statistics on that.

Figure 5 - U.S. electrical generation by source, 1998-2009
(Source: chart by author; data from US Energy Information Administration)
As you can see, the largest proportion of U.S. electrical generation comes from coal-fired generating stations. This has been declining in recent years as some coal-fired generating stations have begun to convert to natural gas, a process that may accelerate as gas prices continue to drop, due both to a fall-off in demand (a consequence of the recession), and to the discovery of massive new shale gas fields in the U.S. Oil-fired generation makes up a tiny and declining proportion of electrical generation. The use of natural gas in gas-fired and combined-cycle generating stations is expanding heavily, both as a replacement for coal-driven boilers and for other reasons which I will go into in a moment. Nuclear power has been relatively stable for the past decade; indeed, due to the regulatory impediments to nuclear generation, no new reactors have come on line in the past three decades. All increases in nuclear generation have been the result of improvements in available capacity, to well above 90% in most cases. Hydroelectric generation has declined slightly, while the small proportion represented by solar, wind, biomass and other "renewable" generation sources has increased slightly.
The growth in wind power (which, due to heavy government subsidization, is, according to the EIA, the "fastest growing source of new electric power generation") is largely responsible for the far more significant growth in natural gas-fired generating stations. The intermittent nature of wind power (turbines rarely exceed a 25% capacity factor) is such that in order to maintain balanced loads across transmission systems, high-readiness conventional generation capacity must remain on standby for periods when wind generation declines. Gas-fired turbine generation, while relatively expensive to operate, is far more responsive than coal-fired boilers to drop-offs in wind power availability, and thus is the backup system of choice for wind turbines. Nuclear generation is, of course, more responsive even than gas-fired turbine generation, as well as considerably cheaper per kWh; however, all U.S. nuclear plants are already operating at or very close to their nameplate capacity, and thus have no excess capacity left over to compensate for sudden drop-offs in wind generation.
As figure 5 makes clear, the largest proportional decline in electrical generation resulting from the drop in consumption has been in the area of coal-fired generation. Notwithstanding that this is the result of a bruising economic crisis resulting in unemployment levels not seen since the Great Depression, there is, happily, a silver lining. Carbon dioxide emissions fell 8.6% from 2008, with emissions from coal-fired generating stations falling by 11%. CO2 emissions from electrical generation in the U.S. in 2009 were lower than at any time since 1998. This is not surprising, given that U.S. electrical consumption in 2009, as a consequence of the current recession, has fallen to pre-1996 levels.
Can we confirm this decline? Yes, easily enough. According to U.S. EIA figures, carbon emissions from fossil fuel consumption dropped across the board last year:
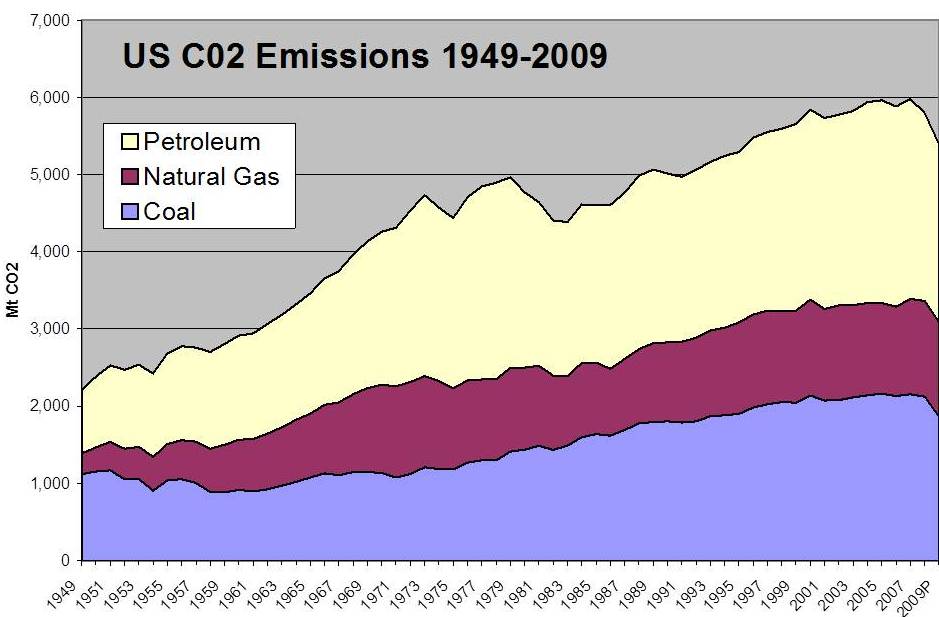
Figure 6 - U.S. Carbon Dioxide Emissions 1949-2009
(Source: Chart by author; data from US EIA)
Across the U.S. economy, emissions from coal declined by 12%; from natural gas, by 1.6%; and from petroleum - by far the single largest energy source in the U.S. due to its key role in transportation - by 5.3%. This averages out to a 6.97% decrease in carbon dioxide emissions from 2008 figures - pretty significant numbers.
What these data tell us is that there is not only a direct correlation between energy consumption and per-capita GDP or wealth (or, using the terminology of biological competition, "success"); there is also a direct correlation between economic activity and carbon emissions (which itself is a not unexpected conclusion based on Bejan and Lorente's 'constructal law' understanding of energy in a closed system). The decline in carbon emissions is both a consequence and a measure of declining economic activity. It also provides an empirical baseline for calculating what further efforts would be necessary to enable the U.S. to meet its Kyoto targets, had the Senate chosen to ratify the Kyoto Accord. The Kyoto Protocol committed Annex I countries to a reduction of CO2 emission to 5.2% below 1991 levels. As we see from figure 6 above, in 1991 the U.S. emitted 4975 Mt of CO2; a 5.2% reduction would require reducing emissions to below 4716 Mt CO2 per annum, an emissions level last seen during the depths of the Reagan recession and the 1973 Oil Shock.
To put the problem in a different light, from 2008-2009 the present recession caused U.S. CO2 emissions to fall by 405 Mt. In order to reach the target of 4716 Mt, they would have to fall by a further 689 Mt, for a total of 1094 Mt below 2008 levels.
In monetary terms, the CIA Factbook reports that the U.S. GDP declined by 2.6% from 2008 to 2009, from $14.5T to $14.12T, a net loss in productivity of $380B. Assuming a linear arithmetic relationship between declining GDP and declining CO2 emissions, therefore, the cost of meeting America's Annex I Kyoto Protocol target would be a further decline in GDP of $646B, or an aggregate decline of a little over $1T from 2009 GDP figures ($1.026T).
I realize that the bandying-about of "trillion-dollar deficits" has begun to inure us to the shock of big numbers. According to the World Bank, though, there are only 12 countries in the world whose GDP exceeds $1T per annum. Canada barely makes that list. Implementing the Kyoto protocol, in other words, would cost the US more economic activity than 95% of the world's nations generate in toto. Put another way, the baseline budget for the US military in 2010 was $663B; with extra-departmental defence-related expenditures incorporated, the cost of sustaining all US military activity in 2010 was about about $1.1T [note 2].
Should the current recession continue, and - as a consequence thereof - energy consumption and, therefore, carbon dioxide emissions continue to decline at the present unprecedented rates, that target might be achievable in the next few years. That said, while the relationship between GDP, energy consumption and carbon dioxide emissions appears to be linear, there is no reason to expect that it is arithmetic; in all probability the lost productivity and declining consumption of the past two years likely represents the "low-hanging fruit" of the U.S. energy economy. In other words, the first 1/3 of a trillion dollars in lost productivity, and all of unemployment, collapsed banks and businesses, mortgage defaults and other associated economic pain, is likely to have been the easy part. The next 2/3 of a trillion - should the current recession continue - would probably see declining energy consumption and declining GDP pare things considerably closer to the bone.
What's important in all of this is to understand which way the arrow of causality points. The U.S. EIA, in its summary of electrical generation statistics for 2009, states that "Environmental developments played an important role in electricity markets in 2009". It's impossible to over-emphasize how wrong this is. In fact, as the foregoing data demonstrate, it was the electricity market - as well as all other energy markets, and for that matter the bond market, the housing market, and the stock market - that played the crucial role in environmental developments over the past year. Declining CO2 emissions are the consequence, not the cause, of the contraction of the U.S. economy and the resultant declining demand for electricity, and indeed for energy of all types. That said, though, it is not unthinkable that the arrow of causality could be reversed by political fiat. The passage of the Waxman-Markey bill, for example, and the consequent imposition of additional economic costs and therefore constraints on emissions, could easily turn the crank in the other direction, mandating emissions reductions, which - given that petroleum, coal and natural gas account both for virtually all U.S. CO2 emissions, and for the lion's share of energy consumed in the U.S. - would lead inevitably to reductions in energy consumed, and therefore in economic activity, and therefore, as suggested above, in GDP.
In chemistry, an exothermic reaction gives off heat; and endothermic reaction consumes it. While all chemical reactions are naturally unidirectional, as with most systems, you can make some of them go backwards, if you push hard enough. The three caveats that apply to such attempts are, first, that it may take an awful lot of effort - or energy - to force a naturally-occurring reaction to go in an unnatural direction; second, that if you push any naturally unidirectional system too hard in the wrong direction, you run the risk of breaking it; and third and finally, that it's rarely a good idea to try cranking a mechanism backwards until you understand how it works going forward.
Just some food for thought as we slide inexorably into what seems to be shaping up to be a chilly, and therefore energy-intense, winter.
Cheers,
//Don//
Notes
Useful sources:
- US Energy Information Administration: http://www.eia.gov/aer/overview.html, http://www.eia.gov/cneaf/electricity/epa/epa_sum.html
- US Population data: http://www.npg.org/facts/us_historical_pops.htm, http://www.census.gov/popest/