Saturday, March 24, 2012

24 January 2011 – Maunderings on trend projection

Colleagues,

Last week, the University of Calgary published a study predicting that the world’s glaciers and ice shelves would collapse by the year 3000.  You can read about it here.

This projection contradicted data published by the National Climatic Data Centre (NCDC) in the US, which recently released its temperature figures for the month of December.  I don’t know how to break this to you, but melting glaciers are the least of our worries.  According to present climatic trends, Minnesota will be uninhabitable in only a little over two centuries. 

Well...more uninhabitable. 

The data published by the NCDC suggest that, at some point in December 2289, the average temperature in Minnesota will reach absolute zero.  Helium will become a solid, all molecular motion will cease, and we’ll finally find out whether the laws of thermodynamics are really just a bunch of hokum made up by physicists who want to keep all the perpetual motion for themselves.

Impossible, you say?  Absolute zero can’t be achieved even in a lab, you say?  Oh, ye of little faith!  The data are indisputable.  Minneapolis is hurtling towards icy oblivion at this very moment, careering into a frigid abyss whence there can be no return.  You don’t have to trust me - just look at the trend!

Figure 1: NCDC climate data, Minnesota, December, 2002-2009; trend = -16.44F/decade (note A)

According to the last seven years of official US government temperature data, the average temperature in Minnesota in December is declining by 16.44 degrees Fahrenheit per decade.  It’s getting cold, fast.  There’s a silver lining, though; in only a little over 50 years the average December temperature will have fallen to well below -80 C, which means that all of that pesky carbon dioxide will freeze, precipitate as snow, and can be shovelled up and packed away in the reefer, never to trouble us again.

You can’t argue with figures; it’s going to happen!  These are MEASURED DATA, people!

Meanwhile, did you know that the long-term trend of a sine wave is a straight line?  No, I’m not kidding.  The equation y = sin(x)m where x is expressed in radians produces a repeating curve that gives values for y ranging between 1 and -1.  If we pick two points on that curve, we can extract a trend line.  For example: (π/2,1) and (-π/2,-1) gives a trend line where Δy / Δx = 2/π.  The equation of that line is y = 2x / π.  This, again, is not the same as the equation for the sine curve; it’s a straight line trending upwards to the right of the chart, forever, whereas the sine wave cycles between a y value of 1 and -1, never exceeding either.  To drive the idea home, try it with different points.  Selecting the points (π,0) and (-π,0) gives you a line with a slope of 0.  Selecting the points (-3π/2,1) and (-π/2,-1) gives you a line with a slope of -2/π.

See what I’m getting at?  By carefully selecting the end-points for your trend analysis, you can derive, from a simple sine curve, a linear trend proceeding infinitely upwards at a slope of 2/π; a linear trend proceeding infinitely downwards at a slope of -2/π; or a linear trend proceeding infinitely onwards at a slope of 0.  And none of them bear any genuine relation to the curve from which they were derived.  In short, when you project a linear trend from a cyclical curve, the direction of the trend depends on the end-points you select.  Select your end-points carefully, and you can produce just about any trend you like.

Okay, back to Minnesota, where by the end of the century they’ll be dodging puddles of liquid oxygen in the parking lot.  As will be obvious from the foregoing examples, deriving a linear trend from a curve and projecting it indefinitely into the future is clearly an exercise that is open to manipulation based on how cleverly you select your endpoints.  In asking the NCDC plot generator to give me the above plot, I selected a year with an unusually warm December (2002) for the start of the calculation, and a year with an unusually cold December (2009) for the end.  Doing that gave me a linear temperature trend of -16.44F per decade - which, extended into the future, means that in a century, the average winter temperature in December in Minnesota will be about -170F.

Bundle up, right?  It won’t help.  If we change the end-points to 2005 and 2007, the NCDC gives us a trend of -23.5F/decade.  Absolute zero in only a century and a half!  Minneapolis is doomed!

But it’s not doomed, because three years do not a trend make.  Nor do twenty, especially when you can pick which twenty years you look at to give you the result you want.  Let’s go back to the Minnesota data.  Take a look at 2 different twenty-year periods in the data:


Figure 2: NCDC climate data, Minnesota, December, 1931-1951; trend = -1.82F/decade (note A)

 
Figure 3: NCDC climate data, Minnesota, December, 1983-2003; trend = +5.46F/decade (note A)

Which of these trends is accurate?  Which one should we trust to give us an idea of where temperature is going over the long term?

The answer is ‘neither’.  These are all examples of a failure of analysis known as the ‘end-point fallacy’, which is the argument that a short-term trend extracted from a long-term series is necessarily representative of the long-term series, and may be substituted for it.  In logic this is known as the fallacy of composition, i.e., inferring the shape of a composite entity from the shape of one of its constituent parts - akin to inferring, from the shape and structure of a tire, that an entire car must necessarily be circular and made of fibreglass belts and vulcanized rubber. In reality, though, you can only determine the shape and structure of the car by observing the whole car - just as you can only determine the shape and structure of a sine wave by observing the whole wave (at least for a sufficient number of cycles to determine its equation).

This is one of the key weaknesses of linear trend projection.  While it is one of the least unreliable forecasting tools available to scientists, its utility is highly conditional, and it is weakened by imperfect understanding of the nature of the trends we are attempting to project.  How do we get around it?  Well, we MUST extract a linear trend from a cyclical phenomenon, we can minimize our failures by maximizing the observational baseline for the trend.  So in the case of December temperatures in Minnesota, we have to look at all the data available.  There’s quite a lot, actually.  More than a hundred years’ worth.

Figure 4: NCDC climate data, Minnesota, December, 1895-2010; trend = +0.1F/decade (note A)

If we expand the analysis of the curve to the full 115 years of data that are available, we find that the average annual December temperature in Minnesota has ranged from a low of 0 F in the early 1980s, to a high of 25F in the 1940s.  We also find that the trend line is an increase of +0.1F/decade (or +0.056C/decade).  December temperatures in Minnesota warmed at a rate of half a degree Celsius per century (which is less than 3/4 of the 0.7C/century increase in average global temperature posited by the IPCC).  The warming trend in Minnesota December temperatures, furthermore, is 1/250th or 0.4% of the observed variability.  That’s a lot more reasonable than predictions of plunging or skyrocketing temperatures based on linear projections derived from selection of more proximate end-points.

The real problem with linear trend analysis, of course, is that the temperature trend isn’t really linear at all - it’s cyclical.  If we projected even that slight half-degree-per-century warming 1000 years into the future, we’d logically conclude that Minnesota Decembers would be 5C warmer than average in the year 3011.  But how valid would such a conclusion be?  And more to the point, how useful would it be?  Presumably somebody will still be living in Minnesota in the year 3011 (it’s at least a little more likely if the winters are 5 degrees warmer than they are at present); but if we consider the range of unforeseeable events that might “shock” us, and the fact that the trend we are linearly projecting is cyclical and demonstrably non-linear, then the unreliability and inutility of long-term linear projection become depressingly clear.  The longer the predictive timeline, the greater the statistical likelihood of error.

When we attempt to apply this method to social scientific analysis, we are also crippled by the fact that linear trend projection makes no allowance for unforeseeable, watershed events.  The classical example is London’s great manure crisis.  In 1900, the city of London had 11,000 horse-drawn cabs and several thousand buses, each of which required twelve horses per day.  Add to these the horses necessary to draw goods wagons, carts and private conveyances, and the number becomes quite significant.  New York City, in 1900, was in similar straits, with more than 100,000 horses, producing an impressive 2,500,000 pounds of manure per day, all of which had to be collected and removed.  This “fertilizer crisis” was so severe in large cities that one author writing in 1894 for The Times of London predicted that “in 50 years every street in London would be buried under 9 feet of manure.” (note B)

This did not happen, of course; the internal combustion engine, still a relative novelty in 1894, eventually replaced the horse – and far more rapidly in the cities than in the countryside.  A half-century after 1894, the streets of London were indeed buried – but they were buried in rubble rather than manure, the result of five years of mechanized warfare featuring high-altitude piston-engined bombers, pulse-jet-driven flying bombs, and liquid-fuelled ballistic rockets – weapons that would have been deemed the height of fantasy by a writer sitting in fin-de-siècle Britain, solemnly predicting that the Imperial capital was doomed to be smothered in equine feces.  The author of that piece had made the fatal error of deriving a linear trend from a non-linear phenomenon, and projecting it fifty years into the future.  He also made insufficient allowance for the “technology shock” of the internal combustion engine - which of course he could never have reasonably been expected to allow for in the first place.  “Shocks” are by definition ex-post-facto phenomena.  They only “shock” us because we failed to foresee them; if they can be foreseen, then they cannot shock us.

And the solution to that part of the problem is parsimony.  If we absolutely must derive linear trends from non-linear phenomena and attempt to project them into the future, then the only way to minimize the certainty of error is to use all of the data available to us to better understand the nature of the phenomenon were are trying to understand; to acknowledge all of the possible sources of error, and bubble-wrap our analysis in caveats; and to keep the period of our artificial linear projection as short as we possibly can.

The importance of parsimony in trend projection cannot be overstated.  Exactly 100 years ago, the pre-eminent technologist of the era, Thomas Edison, was asked to envision the technology of the year 2011, a century hence.  His answers were published in the June 23, 1911 edition of the Miami Metropolis.  Among Edison’s predictions were the following:
·         Electric trains driven by hydroelectric power (correct);
·         The demise of the steam engine (“as remote an antiquity as the lumbering coach of Tudor days” - incorrect, as coal- and oil-burning steam turbines produce most of the electricity on the planet, just as they did in Edison’s day);
·         Travelers “will fly through the air, swifter than any swallow, at a speed of two hundred miles an hour” (right on flight, but off by a factor of four on velocity);
·         Houses will be built and furnished entirely out of steel (“The baby of the twenty-first century will be rocked in a steel cradle; his father will sit in a steel chair at a steel dining table, and his mother’s boudoir will be sumptuously equipped with steel furnishings” - incorrect; while steel is more widely used these days, plastic is the ubiquitous material, while houses are still built predominantly out of concrete, bricks and wood);
·         Future books will be printed entirely on “leaves of nickel, so light to hold that the reader can enjoy a small library in a single volume. A book two inches thick will contain forty thousand pages, the equivalent of a hundred volumes; six inches in aggregate thickness, it would suffice for all the contents of the Encyclopedia Britannica. And each volume would weigh less than a pound.” (Incorrect - although this would be really cool);
·         We’ll all be riding in golden taxis due to the demise of gold as a monetary standard.  Edison was right about the last, but for the wrong reason; he argued that we would soon be able to transmute iron into gold (“We are already on the verge of discovering the secret of transmuting metals, which are all substantially the same in matter, though combined in different proportions...Before long it will be an easy matter to convert a truck load of iron bars into as many bars of virgin gold.” - very incorrect, to say the least).(note D)
It’s crucial that we recognize that in making these predictions, Edison was not predicting anything revolutionary; he was working from known technological discoveries and ideas that existed in his time, and projecting them a century forward.  Why shouldn’t he predict aircraft flying at 200 mph in another century?  Airplanes were already flying at close to 100 mph when he made his prediction.  Doubling that after a century’s worth of work would not be a stretch.  As for being right on electric trains and hydroelectric power, this isn’t surprising given that Edison had himself opened one of the first hydroelectric generating stations thirty years earlier, in 1882.  None of this was truly earth-shattering.
What’s more important is what he didn’t predict.  He predicted none of the things that really changed the modern world: antibiotics, jet engines, television, nuclear power, nuclear weapons, genetic engineering, synthetic polymers, computers, space travel...the list is endless.  It’s not Edison’s fault; the man wore starched collars, had never heard of a “tank”, and might have taken over-the-counter radium pills.  Even in places where there were clues - the “wireless”, for example, was well-known in his time, and the base technologies necessary for “television” would be in place before his death - Edison didn’t “blue-sky” anything.  Everything he predicted was evolutionary, not revolutionary.  And he still got most of it wrong.
Let’s be fair, though.  How could Edison have rationally predicted space travel anyway? Even if he thought it might one day be possible, there was nothing to base his prediction on.  It would be another 15 years before Goddard launched the first liquid-fuelled rocket.  Having never seen a liquid-fuelled rocket, how could Edison have imagined that only fifty years after Goddard’s launch - which Edison lived to see - we would be using colossal versions of that rocket to dispatch robots on journeys that would take them out of the Solar System (and to threaten each other with weapons capable of unimaginable devastation)?  Even if he’d dreamed of space flight, like his contemporary H.G. Wells had done, Edison, as a serious and practical scientist, couldn’t have made such predictions without sounding like a fantasist at best, and a lunatic at worst.  Voyager was simply not predictable from the knowledge base of his era.  None of the reasonable “trend lines” of 1911 pointed at space travel.  There was no rational way to get to “here” - the present that we know - from “there”, Edison’s day.  Meanwhile, those trend lines that did make sense to him pointed at a lot of things - like nickel books, steel houses, and gold taxicabs - that were never to be.  Edison’s only accurate predictions in that article - electric trains, hydro power, and 200 mph aircraft - were simply marginal refinements of things that were already being done.
Minnesota’s impending icy doom and Edison’s gold taxicabs illustrate the problem that analysts face whenever we are asked to look to the future.  The best we can do is work from a comprehensive knowledge of the past, and make reasonable, parsimonious, short-term predictions based on every last scrap of data we can muster.  The alternative is to eschew study of historical trends, selecting our endpoints creatively to hype the story we’re trying to sell, and projecting the derived linear trends decades into the future, secure in the knowledge that we’ll all be retired or dead before our predictions are disproven.  Even if we take the prudent, scientific course, like Edison did, we’re going to be wrong most of the time.  The people who, in 1911, invested in hydro power, electric trains and aircraft presumably did fairly well.  Those who sold all of their soon-to-be-worthless gold and put their money into the nickel book-printing and all-steel-housing industries, though...
Bottom line, whenever we pull the lever on the What-If? machine, we’re taking a risk.  We can apply science to mitigate that risk, or we can allow our imaginations free rein and have fun with it.  Like that chap in London who in 1894 projected a near-term trend into the distant future and found that it led inevitably to nine-foot-deep piles of manure, I guess it all comes down to what we feel like shovelling.
//Don//

Notes
(A)    [http://climvis.ncdc.noaa.gov/cgi-bin/cag3/hr-display3.pl]

(B)    Stephen Davies, “The Great Horse Manure Crisis of 1894”, The Freeman, September 2004, 33 [http://www.fee.org/pdf/the-freeman/547_32.pdf].

(C)    http://www.livescience.com/environment/long-term-climate-change-predictions-110112.html

(D)    http://www.paleofuture.com/blog/2011/1/18/edisons-predictions-for-the-year-2011-1911.html

18 January 2011 – Let the sun shine in

The fault, dear Brutus, is not in our stars / but in ourselves...

Colleagues,
You’re not who you thought you were.  And gravity’s to blame.
Ever since it was introduced by the Babylonians more than three thousand years before the birth of Christ, astrology has served mankind as a means of unscrewing the inscrutable - of finding meaning for terrestrial events in extraterrestrial happenings.  Proxies for the acts of the gods and their minions, the constellations, their rising and setting aspects, and their relative seasonal positions in the heavens have been believed to have an influence on the day-to-day doings of one particular species of bipeds here on Earth.  And that belief is still pretty strong.  According to a 2008 Harris poll, 31% of Americans believe in astrology - the same number that believe in witches (one hopes that it’s the same individuals, but that’s not clear from the polling data).  Belief in astrology is more common even than belief in reincarnation.  One might take comfort from the fact that the same poll reported that 47% of US respondents “believed” in the Darwinian theory of evolution, were it not for the fact that 75% believe in “miracles” (insert obligatory sports joke here).  Anyway, what’s interesting about the poll data is that belief in astrology correlated more with Catholicism than Protestantism, and with regular but infrequent church attendance.  So it’s not all atheists, Wiccans and tie-dyed Age-of-Aquarius types making up the numbers (note A).  A similar poll conducted in 2009 found belief in astrology down to 26%, but this time 17% of respondents were “unsure”.  This was, incidentally, up from 25% in 2005 (note B).
Lest you think I’m picking unfairly on our American cousins, belief in the predictive power of astrology is widespread and very consistent across the English-speaking world.  A 2005 Gallup poll, for example, showed that while 25% of Americans believed in astrology, 25% of Canadians shared the same belief, along with 24% of Britons (note C).  That same poll, incidentally, showed that women were far more likely to believe in paranormal phenomena than men; the ratio of female to male proponents of astrology was 28% to 23% in the US, 33% to 17% in Canada, and a whopping 30% to 14% - or more than 2 to 1 - in Britain.
(Off topic, but that poll also showed that while the male-female split was similar, if not as pronounced, for belief in haunted houses, communication with the dead, and witches, it reversed itself in one specific area: men in all three countries were uniformly more likely than women to believe that aliens had, at some point in the past, visited the Earth.  If that’s not grist for future analysis, I don’t know what is).
Clearly even in this enlightened age astrology has an enduring hold over the human mind.  So it should come as no surprise that the astrological community rose up in righteous outrage when it was announced last week that the zodiac was short by one astrological sign.  Parke Kunkle (yes, that’s his name), a member of the board of the Minnesota Planetarium Society, told the Star Tribune that the precession of Earth’s rotational axis (the same phenomenon that means that Polaris isn’t going to be the “North Star” in another couple thousand years) meant that the Age of Aquarius was, in point of fact, really the Age of Pisces - a blow not only to generations of professional palmists and navel-gazers, but also to Fifth Dimension’s lyrical scansion.  Your “sign”, you see, is determined by the position of the Sun in the sky at the moment of your birth - a matter of some precise calculation.  The ancient Babylonians knew they had a problem with the constellations that the Sun seems to travel “through” over the course of the year, and they simply jettisoned one.  According to Kunkle, “we’re off by ten degrees or so,” and the abandoned constellation - Ophiucus, also known as the Snake-Bearer - needs to go back into the rotation (note D).  It’s not the first time an adjustment has been necessary; Libra didn’t make it into the batting order until 2000 years ago.
What does all of this mean?  Well, for the 75% of us that lump astrology in with fortune cookies, nothing.  But for the 25% that believe in the predictive power of astrology, the thing is...they’ve been reading the wrong horoscopes.  Adapting to the reality of precession means that the signs are offset by a day for every 70 years that pass, so to catch up we all have to shift a little bit left in the calendar.  I, for example, once a Pisces (“generous, caring and kind”), am now an Aquarius.  On the upside, I suppose this means that my astrological predisposition to “escapism, fantasy, drugs (especially alcohol), a small nose, a weak jaw, and a double chin” will spontaneously transform to “emotionally detached utopian idealism” characterized by “a high forehead, a slender figure, an aquiline nose, and a vague expression” (note E).  I would take comfort in the fact that I should be joining celebrity Aquarii like Clark Gable, Nick Nolte, and Alan Alda - except that, thanks to Kunkle, they’re all now Capricorns, so I’ll still be stuck with my fellow former-Pisces uggos Sally Jesse Raphael, Erma Bombeck, and Ted Kennedy.
Meanwhile, everyone born between November 29th and December 17th has now got a new sign: Ophiucus.  The name comes from the Greek “Ὀφιοῦχος” which in fact means “Serpent-Bearer”.  For those of you astronomically rather than astrologically inclined, Ophiucus is located in Serpens, north of Antares, and is made up of two stars and five star clusters: Ras Al Haque (Alpha Ophiuci, an A5 blue-white giant 60 LY distant); Cheleb (Beta Ophiuci, a K2 yellow giant 100 LY distant); and M9, M10, M12, M14 and M19, all globular clusters of magnitude 7-9.  For those more classically oriented, Ophiucus is associated with the tale of Asclepius, the physician who cured Orion of a scorpion bite to the heel.  As the story goes, he became so skilled at healing that Hades felt his realm threatened, prompting Zeus to whack the successful doctor with a lightning bolt.  Zeus thereafter placed Asclepius/Ophiucus in the sky, perhaps as some sort of post-homicide “achievement in the field of excellence” award.  I guess there’s such a thing as being too good at your job.

Figure 1 - Ophiucus the Serpent-Bearer, and his sign

The good news is that the newly-minted Ophiucans get to join Britney Spears, Taylor Swift, Jennifer Connelly, Billy Idol, and (gasp!) Ozzy in the club of late-November to early-December celebrities.  The bad news is that Woody Allen’s there, too.   Another plus is that, for collectors of Zodiac-themed tchatchkes, there’ll soon be another one to add to the mantle-piece (Christel Marrot’s Royal Copenhagen Zodiac line is particularly impressive).

What on Earth does all of this have to do with strategic analysis?  Well, history - especially military history - is replete with examples of great events being preceded by attempts at divination.  Rome, despite its manifest dedication to reason, adopted astrology from its Greek slaves and educators, and positively teemed with auspexes, haruspexes, and augurs of all description (according to the Annals of Tacitus, augurales were even established in legion camps).  Roman statesman regularly had their horoscopes updated to determine auspicious and inauspicious times for business and other affairs, and didn’t stir out of doors on days when the signs were ill.  Even the warning hurled at Caesar by Shakespeare’s unidentified soothsayer to “beware the Ides of March” was reportedly originally issued by a Roman astrologer named Spurinna.  According to the play, Caesar was sufficiently taken with prophecy that he considered heeding the warning; the Bard has Cassius fret that Caesar “is superstitious grown of late / Quite from the main opinion he held once / Of fantasy, of dreams, and ceremonies,” and worries that ”these apparent prodigies, / The unaccustom’d terror of this night, / And the persuasion of his augurers / May hold him from the Capitol today,” and thereby avert the plotters’ sanguinary vote of no confidence.  Caesar thereafter consults “the augurs”, who fail to find a heart within the sacrificial beast; but he ignores the omen, noting that “the valiant never taste of death but once”.  Back in the real world, Suetonius and Plutarch tell different stories about why Caesar chose to ignore the warning; but whatever the excuse, the result was the same, and he ended up on the Senate floor, done in by a pack of “honourable men”.  I suppose the moral is that if a bearded weirdo shouts advice at you on the street, you should take it.

As for the to-do over Ophiucus, it’ll come as no surprise to the billion folks in India who follow a sidereal (Jyotish) rather than a tropical zodiac. The difference between the two is that sidereal astrology is fixed to the position of the Earth relative the background stars, i.e. the galaxy, whereas tropical astrology is fixed to the position of the Earth relative the solar system.  Sidereal fixation negates the precession problem that is now afflicting the tropical astrologers.  The two cycles coincided and overlapped about 1600 years ago but have been steadily diverging ever since, and now they’re offset from each other by 24 degrees (exacerbating the 10 degree offset of tropical astrology from itself).  So an Indian born under the sign of Virgo isn’t really born under the same “sign” as an American born under Virgo. Add to this the fact that Indians tend to refer to where the Moon is at birth, rather than the Sun, and what you’ve got is a recipe for astrological mayhem.

I guess the bottom line is that the stars aren’t steered by love any more than the planets are guided by peace; they’re both yanked around by gravity, a consequence of which is the precession of the equinoxes, which we’ve known about since Hipparchos figured it out at some point between 146 and 130 BC.  Given that we’ve had the info in hand for more than two thousand years, I’d say it’s long past time for astrology to update its methodology.  Science, after all, adapts to new facts.  While they’re at it, they might consider adding the post-Copernican satellites into their calculations, too, since these have been traditionally ignored despite having been visited repeatedly by our robots.  I suspect their reluctance has something to do with having to write horoscopes explaining where Uranus was and what it was doing at the moment of your birth.

I’m also looking forward life as an Aquarian.  Have you ever noticed how they always come first in the newspaper horoscope listings, whereas Pisceans always comes last?  It feels like I’ve been promoted.

Cheers,

//Don//

P.S.  From the cool file: Voyager 1, presently moving at 61,548 km/hr relative to the Sun, is the fastest object ever created by humans, and is on course to pass within 1.6 light years of AC+79 3888, a star located in Ophiucus. 

It’ll get there in 40,000 years.

Notes
[A] [http://www.harrisinteractive.com/vault/Harris-Interactive-Poll-Research-Religious-Beliefs-2008-12.pdf]
[B] [
http://www.harrisinteractive.com/vault/Harris_Poll_2009_12_15.pdf]
[C] [
http://www.gallup.com/poll/19558/paranormal-beliefs-come-supernaturally-some.aspx]
[D] [
http://www.foxnews.com/scitech/2011/01/11/age-aquarius-actually-age-capricorn-thanks-rotation-earth/]
[E] [
http://zodiac-signs-meanings.com/]

Friday, March 23, 2012

12 January 2011 – Political science

Colleagues,

I thought you might be interested in an unfolding issue in the UK that offers what President Obama might call a “teachable moment” for those in our profession, i.e., scientists on the public payroll.  While the origins of the issue in question lie in global warming/climate change/climate disruption/climate challenges or whatever the preferred appellation is this week, the pith of the problem, as I see it, is not the substance, but rather how it has been handled - or mishandled - by our brethren abroad.

First, a little background.  On 25 September 2008, the UK Meteorological Office, Britain’s government-funded weather forecasting agency, issued a press release stating that the coming winter was “once again, likely to be milder than average”.(Note A)  The following March, the Met Office issued a release stating that “The UK mean temperature for the winter was 3.2 °C, which is 0.5 °C below average, making it the coldest winter since 1996/97.”(Note B)  Needless to say, this constituted something of an “oops” for the forecasters.

On 25 February 2009, Peter Stott, a climate scientist at the Met Office, stated in a press release that “despite the cold winter this year, the trend to milder and wetter winters is expected to continue, with snow and frost becoming less of a feature in the future.”  Stott went on to add that “The famously cold winter of 1962/63 is now expected to occur about once every 1,000 years or more, compared with approximately every 100 to 200 years before 1850.”(Note C)  A year later, on 1 March 2010, the Met Office stated that the winter of 2009-2010 had “been the coldest since 1978/79” - the coldest winter that Britain had experienced in more than 30 years. (Note D)  Double oops.

Unperturbed by two grossly inaccurate predictions in a row, on 28 October 2010 the Met Office, according to the UK Daily Mail, suggested that “Britain can stop worrying about a big freeze this year because we could be in for a milder winter than in past years.”  According to Helen Chivers, a forecaster at the Met Office, the projections produced by computer forecasting models showed the probability that winter temperatures would be comparable to average temperatures over a 30-year period.”(Note E)

Well, we’ve all seen how winter is playing out in Britain.  According to the BBC, December 2010 featured the coldest December temperatures in the UK since the Met Office began keeping consolidated records in 1910.  Older records show that December 2010 was the second-coldest December since 1659, when Britain and the rest of the world were locked in the depths of the Little Ice Age. (Note F)  That’s three hundred and fifty years ago.

These are simply the facts; I offer no opinion concerning their broader significance to the “climate debate”.  What’s important is what happened next.  On 4 January 2010, the Telegraph reported that, in October, the Met Office had “privately warned the Government - with whom it has a contract - that Britain was likely to face an extremely cold winter. It kept the prediction secret, however, after facing severe criticism over the accuracy of its long-term forecasts.”(Note G)  The Met Office, in other words, was arguing that it had told the Government something different from what it had told the public.

The problem is that if this explanation is true, the Met Office didn’t only “keep the prediction secret”; they actually issued false press releases and published misleading “temperature probability maps” on their website.  The one below, for example, shows a 40-80% probability of above-average temperatures for the UK for the Nov 2010 to Jan 2011 period; a 20-40% probability of average temperatures; and <20% probability of below-average temperatures.


Figure 1 - UK Met Office October 2010 temperature projection for Europe for Nov 2010 to Jan 2011 (Source: Note H)

(Note how that projection covers all of Europe west of the Urals and north of Algeria, where the 2010-2011 winter has, thus far, been “sub-optimal”.)

The Met Office’s claim to have issued a “secret forecast” to the UK government that was - pardon the expression - the polar opposite of the forecast that it provided for public consumption caused observers to ask the obvious question: is the Met Office lying now, or was it lying then?  Is this latest statement an attempt to avoid the consequences of three failed seasonal predictions in a row?  Or is the Met Office telling the truth, and the “secret forecast” had been received, and subsequently suppressed and ignored, by the Cameron Government?  The implication of the latter explanation, of course, is that the Met Office was muzzled by government and prevented from issuing the “real” forecast about the coming cold spell (and if this was true, was the Met Office also “ordered” by its client to provide the public with misleading information?).  It also begs the question why, if the Cameron Government was warned in October that the coming winter would be unpleasant, Britain was so manifestly caught with its trousers down. 

This is not an idle question; some estimates have placed Britain’s economic losses due to weather-related paralysis in December at a billion pounds a day.  If this was preventable - if the Cameron government had been warned, and for whatever reason failed to act - then the political implications could be enormous.  Governments have fallen over less.

Answers may be on the way.  Just yesterday, the BBC submitted a Freedom of Information request asking the UK Government for verbatim transcripts of everything the Government was told by the Met Office about the forthcoming winter weather.(Note I)  One would think that the Met Office, feeling the pressure after having been disastrously wrong three years in a row, might have leaked its “secret October forecast” by now, but there is as yet no circumstantial evidence to support the Met Office’s claim.  Quite the contrary, in fact.  In July of last year, for example, the UK Government received the interim report of an independent review into how Britain’s transport agencies coped with the two preceding winters (the Quarmby Report, Note J).  When consulted by the report’s writers, the Met Office stated that “The effect of climate change is to gradually but steadily reduce the probability of severe winters in the UK”, and added that the probability of the 2010-11 winter being as severe as the two preceding winters was “about 1 in 20” (Quarmby Report, p. 13).  A 5% chance of severe weather hardly sounds like a warning that Britain was about to face an “extremely cold winter”.

It will be interesting to see what the BBC’s FOI request turns up.  If nothing else, this incident offers a grim reminder of the pitfalls of politicization for those engaged in government-funded scientific research.  The truly depressing part is that regardless of which explanation turns out to be true, the Met Office scientists have been caught in a lie: either they are trying to cover up their forecasting inadequacies by lying about having warned the government of an impending cold winter; or they tried to curry favour with their client by telling the government one thing, and telling the public (their real paymasters) something entirely different.

Whichever explanation turns out to be true, the Met Office’s reputation is pretty much shot - and they are unlikely to get a lot of sympathy from Britons who spent most of December waiting on trains, stuck in Heathrow, crawling along unplowed and ungritted roads, coping with heating fuel shortages (and a 5-gigawatt wind power grid that spent the month consuming more energy than it generated - Note K), and in general trying to survive in a country that, thanks to the politicization of the science of weather forecasting, was woefully unprepared to cope with the coldest December in more than a hundred years.

Cheers,

//Don//

Notes

(I) [http://canadafreepress.com/index.php/article/32017]
(J) [http://transportwinterresilience.independent.gov.uk/docs/interim-report/press-release.php]
(K) [
http://www.dailymail.co.uk/debate/article-1342032/You-dont-need-weatherman-know-way-wind-blows.html]


Thursday, March 22, 2012

4 January 2011 – Decrypting culture through statistical analysis of language

Colleagues,

On New Year’s Day I came across a copy of a BBC special that aired last year.  Those of you who follow the TED lecture series (and I’m not suggesting you should, as a lot of them are nonsense) may recall a presentation a few years ago (note A) by Swedish global health expert Hans Rosling.  The presentation, while informative in its own right, was less interesting for the data than for the manner in which Rosling used computer presentation software to show how the data changed over time.  This year’s BBC special took the subject of statistical data to a whole new level.  Entitled “The Joy of Statistics” and narrated by Rosling himself like some sort of Nordic James Burke, the episode explains how the world is awash in all kinds of data, and what makes this period in history fascinating is the fact that we are only now coming into possession of the computer processing power and capacity necessary to enable us to make the most of it.  If you can find (a) an hour out of your schedule, (b) a computer system that actually allows you to watch streaming video (yeah, I know – crazy, eh?), and (c) the intestinal fortitude to spend 60 minutes listening to a Swedish guy who is genuinely passionate about numbers, then I strongly recommend you watch it (note B).

One of the neat things discussed in the video is an in-depth look into how Google Translate works.  Back in the 80’s, having gotten sick of my Smith-Corona, I talked my way into the CMR mainframe lab so as to be able to use the CAD/CAM system to write term papers.  This being the pre-WYSIWYG era, I had to learn to code the desktop publishing software, which required that I routinely seek assistance from one of my computer-engineering comrades.  He’d had to work out the coding system himself in order to make progress on his own fourth-year memoir, which was developing language-recognition software.  What drove him squirrelly was the irregular nature of the English language.  Computers are designed to work within and by rules – “if THIS, then THAT” – and English is notorious for observing few rules, and breaking those it DOES observe with gleeful abandon. 

As a composite language with both Germanic and Latin roots and words imported from dozens of other languages, the irregularities of English have been causing computer programmers to tear their hair for years.  My colleague had decided to take a rules-based approach to language, and was trying to design a short programme that would tear a sentence apart into recognizable and actionable chunks.  Let me tell you, nobody goes through coffee like a computer science major trying to make sense out of grammar textbooks.  He ultimately failed (in his quest, not his studies), because there were too many exceptions to the rules. 

Google, though, has succeeded.  Most of us, I imagine, have used Google Translate at least once over the past few years.  It’s amazingly accurate – and, if you’ve watched Rosling’s video, what’s especially amazing is that it does it all without rules.  The software works purely by statistical analysis and the power of large numbers.  By trawling websites and making comparisons between previously-translated texts, the software simply develops an ordered list of probabilities of accuracy between the origin language and the target language, and provides the user with a “best guess”.  It also allows the user to submit superior translations for consideration.  It’s absolutely ingenious – and it’s only the tip of the iceberg when it comes to the fantastic array of uses to which we might be able to put the unprecedentedly massive amount of data that is now available to us, and the power of tools like ultra-high speed computers and the Internet to manage it.

Google really is a pioneer in the field of mining information from floods of data.  Just before Christmas they came out with something new and, in my view, even more interesting.  For some years, Google has been engaged in a tremendously ambitious project: the digital scanning of every book ever published.  Stop and think about that for a second – every book ever published.  Apart from the legal ramifications of such a thing (as you can imagine, the lawsuits for copyright infringement are already underway), the research possibilities for the readers of such a database are nothing short of staggering.

But what if you don’t read them?  Google’s watershed insight into the problem of machine translation was to minimize context; to ignore the gestalt of a piece of text and look simply at the immediate context of words next to each other, to throw away the rules and examine only numerical patterns.  What sort of things can you learn by doing that to a massive database of published works?

Enter Google’s “n-gram viewer”, a trial bit of software that’s still in the testing phase.  In order to avoid copyright problems, the fellow who proposed the project to Google in 2007 – Erez Lieberman Aiden, a mathematician following a Ph.D. in genomics at Harvard – suggested converting the scanned book database into a n-gram database: “a map of the context and frequency of words across history”.[note C]  This would enable scholars to conduct research on the scanned database without actually reading the books, and without forcing Google to violate millions of copyrights by releasing the scanned-in data.

How big a database are we talking about, anyway?  Well, the human genome is a “book” of about three billion characters written using only four letters (the amino acids adenine, cytosine, guanine, and thymine).  The Google database is more than two thousand times as big; it currently consists of 2 trillion words taken from 15,000,000 books, or one-eighth of all of the books published in every language since the Gutenberg Bible was printed in 1450.[note C]  That’s an awful lot of data.  To make it searchable, the database had to be converted into n-grams: unigrams (single words or word-character groups), bigrams (double words or word-character groups), trigrams, and so forth.  This required the database developers to make decisions about how to deal with, for example, contractions, compound words, hyphenated words, apostrophes, and so on, with separate decisions made for each of the ten linguistic corpora under development.  The full details of how they went about this task can be found in their paper, which was published in Science last month.[note D]

Obviously, such an approach can be problematic.  According to a review of the new software, researchers wrestling with the database came up with a number of surprising revelations.  The first was that books contain what one lexicographer called “huge amounts of lexical dark matter”.  Even after excluding proper nouns, for example, “more than 50% of the words that ended up in the n-gram database do not appear in any published dictionary”.  Standard reference works tend not to include neologisms even if they are in routine use (e.g., “deletable”), and they also miss genuine but obscure words (e.g., “slenthem”, apparently a type of musical instrument).[note C]  However, these weaknesses, while not exactly compensated for, are overridden by the immense power of the search engine and database combination which, if it breaks down at the micro or technical levels, at least produces fascinating results at the macro or culture-wide levels.

One use of the database has been to track the impact of political interference on ideas.  When the database developers examined the German corpus of published works, for example, it showed a marked drop-off in the 1930s in citations of well-known Jewish or “degenerate” artists (e.g., Picasso) when compared to similar references in the English corpus, which remained steady during the period.  Other uses tested include tracking the relative influence of thinkers over time.  One example given is the comparative frequency of mentions of Darwin and Freud.


As you can see, Darwin held a commanding lead in the late 1800s and early 20th Century.  Interestingly, perhaps as a consequence of the contemporary fascination with psychoanalysis, Freud bypassed Darwin from the 1950s to the mid-1990s, before plummeting again, with Darwin finally looking set to surpass Freud a few years ago (according to one review of the program, he did).

The possibilities are virtually endless, and the only restriction is the researcher’s imagination.  As with any research tool, of course, the value lies in the precision with which search parameters are designed; it would be a mistake, for example, to compare “President Clinton” to “President Bush”, since there have been two of the latter. 


In fact, the data clearly reveal the double hump that is inevitable when you have a Clinton between two Bushes.  If you didn’t know that there had been two President Bushes, though, the double hump would pose a statistical mystery (although you might logically infer from such a double hump that there must have been two different “President Bushes” whose respective impacts on the zeitgeist peaked roughly fifteen years apart).

Similarly, a search for references to “Mao Zedong” reveals virtually nothing before the 1970s, and the numbers don’t really spike until long after his death, which is indicative not of a new emphasis on the Chinese communist dictator, but rather of the ongoing replacement of the Romanized transliteration of his name by the Pinyin transliteration. 


At the same time, though, a comparative search between “Mao Zedong” and “Mao Tse-Tung” fails because the software interprets the former as a bigram and the latter as a trigram.  The only way to get a comparison is to do two separate searches - and doing so reveals precisely when the former spelling overtook the latter in English-language publications.

Adding additional search terms is fun, too.  Returning to the Bush-Clinton comparison above, here’s what you get if you add “President Reagan” to the mix, and roll the search period back to 1970.
The Gipper, it seems, had a more extensive impact on literary culture during his administration than any of his successors.  If we throw Carter into the search as well (moving the search back to 1900, as we’re going progressively back in time here)...


...we find that Jimmy outweighed both George and Bill, but not Dubya or Ron.  This is a little counterintuitive; one would expect Clinton to have had a greater impact on English-language publishing over the course of two terms than Carter had over the course of one.

Peak times are also interesting; it would not be entirely accurate to conclude that references to Slick Willie peaked during his annus horribilis (1999 and the height of “Monicagate”), because references to Carter peaked just as he was handing the White House over to Reagan, and references to Reagan and George, too, peaked right at the end of their terms.  There’s a certain logic in this; one would naturally expect references to individual Presidents to continue to grow as long as they are in office, and to decline after they leave office.

The beauty of the database and the n-gram software, of course, is the ability it gives us to probe deeper into history.  Dumping Jimmy and throwing “President Lincoln” into the search terms (and expanding the search back to 1850), we see that Honest Abe had a far greater impact on English publishing than any recent president. 


More interesting is that fact that instead of a normal (bell) distribution, as has been the case with the past five Presidents, Lincoln gives us a much bumpier graph, with several “comeback periods” around 1890, 1905 and 1940.  Presumably the latter reflects Roosevelt’s incessant references to Lincoln during the 1940 Presidential campaign; it would be interesting to mine the data further to see why, though, Abe’s name bumped in 1890 and 1905.  There also seems to have been a slower but more enduring Lincoln resurgence under way since the mid-1980s.

Well, since we’re already doing this, let’s expand the search to 1750 and include the big guy himself, President Washington.  The result is…well…lacklustre.  But maybe there’s a good historical reason for that – nobody remembers Washington for being President, they remember him for his other accomplishments. 


If we look at three possible permutations of names and titles – George Washington, General Washington, and President Washington – and if we switch to the American English corpus (i.e., books published in the US), then we get some very interesting results.
The key pattern that leaps out at us is that in books published during the French and Indian Wars, Washington was more likely to be known as “George”.  During the Revolution, “General” overtook “George”; and that remained the case until about 1885.  References to “President Washington” have, by contrast, always been relatively insignificant, even during his time in office; and since 1885, books published in the US have been far more likely to refer to Washington by his Christian name than by his military title or presidential titles.  Literary convention? Authorial preference? Reverence for “The Indispensable Man”? Presumably historians would have a better grasp of why references to Washington follow the above pattern.  In the meantime, the “Three Washingtons” problem illustrates why, when using a database like Google’s n-gram viewer, you have to be sure that you’re comparing apples to apples, and not to pomegranates. 

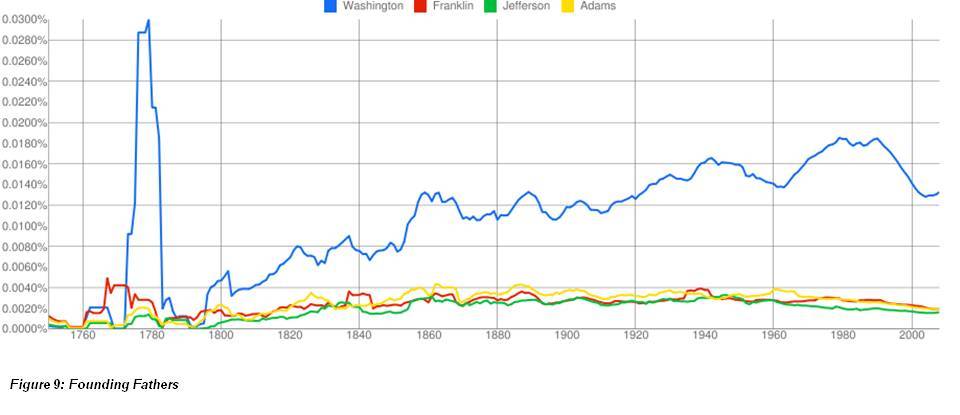
For this reason, while it might be fun, therefore, to compare – for example – Washington, Jefferson, Franklin and Adams…
…the results are not really reliable, even if you’re only using the American English corpus.  It’s easy, for example, to identify the frequency peaks that correspond to the presidencies of John Adams and his son, John Quincy; but “Adams” is not an uncommon name, and the software doesn’t know which one you’re talking about unless you tell it. And you can’t compare “John Adams” with “John Quincy Adams” because of the bigram/trigram problem.

Obviously, as with any other powerful data-mining tool, the possibilities for enjoyment are endless.  God, you might be interested to know, has enjoyed a commanding literary lead over Satan for the past half-millennium.  Religion, meanwhile, after centuries of running ahead of Science, was caught up in the 1920s and overtaken during the Second World War, but appears to be surging ahead again in the past five years.

Interest in sin, always a staple of literature, has likewise evolved in fascinating ways over the past 500 years.

Pride has been a pretty consistent leader over the centuries, except for the late 17th Century, when wrath suddenly got popular (and peaked again during the Seven Years’ War and the Napoleonic Wars - though not, interestingly, during the far more destructive wars of the 20th Century).  Envy’s been up and down, while sloth and gluttony have barely made it onto the radar.  Greed was briefly popular in the mid-1600s, but then more or less vanished until it grew during the fin-de-siècle malaise of the pre-War period, and has more or less corresponded to the rise and sustained popularity of socialist political theory.  Finally, lust popped up at various times in the late 16th and 17th Centuries, but then disappeared until the Pax Britannica, and hasn’t really changed much, proportionally speaking, since Oscar Wilde fell afoul of Victorian society’s “don’t ask, don’t tell” conventions.

What about that little bump in 1520?  Well, this shows where databases become problematic.  That whole column is due to one book - Martin Luther’s “Open Letter to the Christian Nobility of the German Nation”. Because the data are normalized on an annual basis, a single book takes on special significance if the number of books published in any given year is low.

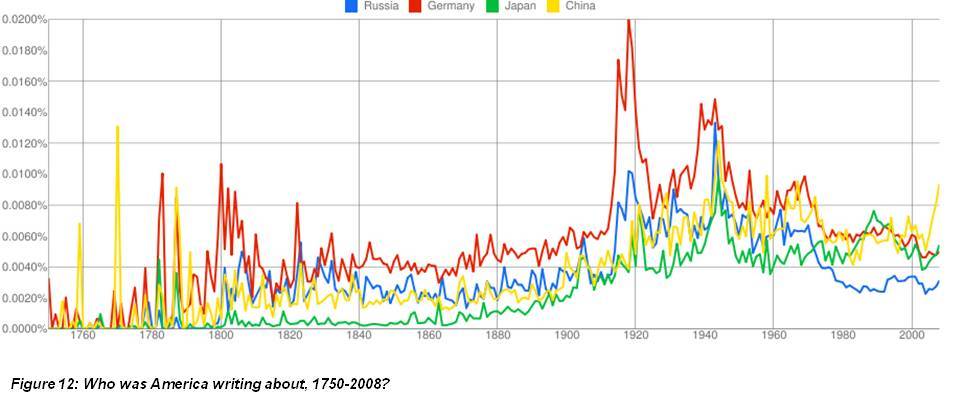
Back to the engine.  Emphasis on different countries in US publishing has shifted significantly over the past 250 years…

…while dessert preferences over the past four hundred, in the English-speaking world at least, have not.  I would love to see an explanation for the big valley between 1950 and 2000 in the chart below.  America certainly didn’t give up on dessert during the explosion of the middle class.

Political flavours have varied, too, with different “-ists” predominating at different times over the past century.
Fascists were big in the 40’s, Marxists overtook communists in the 80’s, and everybody other than anarchists declined precipitously over the past 20 years – which, not coincidentally, is when Islamists first showed up, overtaking anarchists in the last decade, and running neck-and-neck with fascists.
Meanwhile, the appearance of different diseases in the English lexicon not only tracks closely to historical epidemics (at least in the places where English-language books were being written and published), but also reflects the extent to which various diseases tended to dominate popular culture.
The fact that tuberculosis and AIDS have consistently been mentioned more often in literature than far more lethal diseases like influenza (apart from a brief bump during the 1918-20 Spanish Influenza epidemic) and smallpox reflects the role that disease plays as a cultural referent.  There are clear literary parallels between the 19th-Century victim of consumption wasting away in a sanitorium, and the 20th-century HIV patient wasting away in a hospice.  Diseases like anthrax, smallpox, influenza and plague kill their victims too quickly to make useful literary characters.  Oh well, at least cholera got the attention it deserved.

Speaking of cultural fascinations, the database allows us to compare how deeply some terms and ideas have made their way into our collective lexicon.

Witches and ghosts were big throughout the 17th Century, with demons picking up in its latter half (and getting a massive bump in the 1690s), dominating most of the 18th Century, and never really declining in popularity for the next 200 years.  Ghosts took over around about the battle of Jena, and haven’t relinquished the lead since.  The incidence of mummies in published books peaked from about 1820-1920, the period of greatest interest and discovery in Egyptology, and so probably is more reflective of Carter penetrating Tutankhamen’s tomb than of Abbott and Costello subsequently meeting The Mummy.  Vampires, meanwhile, were non-existent until the early 1800s and remained fairly low throughout the 19th Century.  Even the publication of Bram Stoker’s ”Dracula” did not cause an up-tick; vampires got their first real bump during the filming and release of Murnau’s “Nosferatu” in 1921-22.  Werewolves enjoyed a brief blip around the time of the US Civil War due to a sudden flurry of books about eastern folklore (probably as a result of the number of British officers, soldiers and civilians flitting about southern China and the Raj), but otherwise didn’t make much of an impact until the past decade.  The real story, of course, is how the vampire phenomenon jumped a little in the 1970s, and then exploded after the mid-1980s as part of a general upsurge in interest in the occult, likely (one hopes!) as a result of fiction.  In all of this, it’s the discontinuities that are especially interesting.  One wonders why, for example, mention of ghosts in English-language books declined from 1950-1980, while mention of witches and demons increased.

As you can see, there’s more than enough data in the Google book set to keep you busy for the rest of your natural life, and the n-gram viewer engine provides enough functionality for analysts to be able to tease interesting tidbits out of the deluge. 

For those interested in designing their own experiments, the raw n-gram datasets are available for download here: [http://ngrams.googlelabs.com/datasets].  Warning – these are not small files.  The American English bigram set alone consists of 100 zipped files, each consisting of 152 megabytes of compressed data.  The danger isn’t only in the scope of the information; it’s also in the likelihood of misunderstanding of results.  One Berkley linguist called the analyses produced by using the search engine and database combination “almost embarrassingly crude”; but as with all tools, refinement comes with time.  Google’s next target is multi-gram contextual searches, which will enable researchers to examine how the use of given words in context changes over time, enabling linguists (and historians, political scientists, and other students of the way the world works) to track “semantic shifts” over history.  That would be a truly remarkable achievement, and one of immense interest to historians.

Even if the tool itself doesn’t command your attention, the Michel et al. paper is worth a read (see note D - free registration required).  And if you want to try your own comparisons, the viewer is here [http://ngrams.googlelabs.com/], and information about it can be found here [http://ngrams.googlelabs.com/info].

Cheers - and a belated Happy New Year to all!

//Don//

Notes
A)
http://www.gapminder.org/videos/hans-rosling-ted-talk-2007-seemingly-impossible-is-possible/
B) http://www.gapminder.org/videos/the-joy-of-stats/
C) John Bohannon, “Google Opens Books to New Cultural Studies”, 17 December 2010 [http://www.sciencemag.org/content/330/6011/1600.full.pdf].
D) Jean-Baptiste Michel, et al., “Quantitative analysis of culture using millions of digitized books”, Sciencexpress.org, www.sciencexpress.org, 16 December 2010, Page 1, 10.1126/science.1199644. (Free registration required)
E) Obama doesn’t make the list because the database search function ends at 2008.